
Articles
Bibliographic Trends of Nano Diamond Batteries
Bibliographic Trends of Nano Diamond Batteries

Earliest Priority Year Trend – Patent Literature (PL)
The graph below discloses an account of the count of patent applications/publications versus the year from which they are claiming their earliest priority.
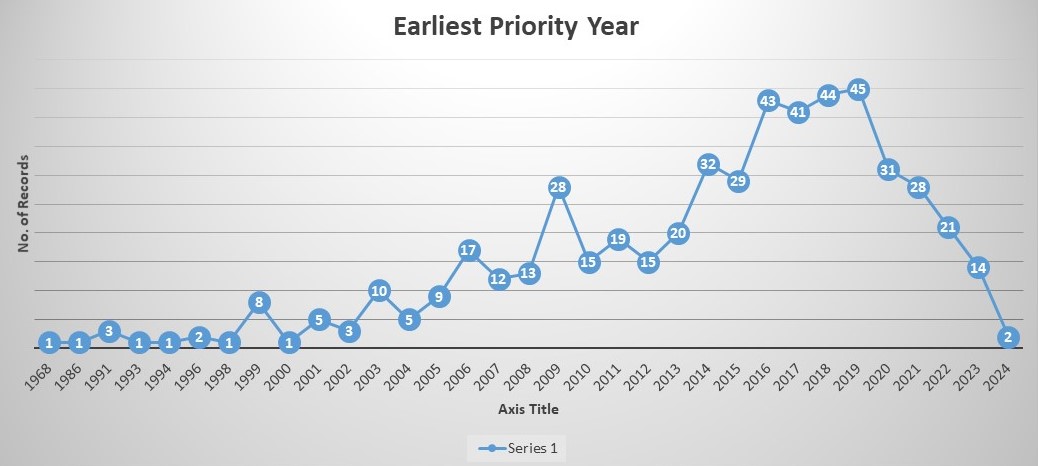
The dataset for PL graph has only been restricted to the field of the Nano Diamond Battery.
The chart titled "Earliest Priority Year" illustrates the number of records associated with each priority year from 1968 to 2024. In the early years (1968–1998), activity remained low and steady, with mostly 1 record per year and a slight increase in 1991 (3 records) and 1999 (8 records). From 1999 to 2009, there was a gradual rise, peaking at 28 records in 2009, followed by fluctuating numbers between 2010 and 2013. A rapid increase occurred from 2014 to 2019, culminating in the highest value of 45 records in 2019, suggesting heightened activity during this period. However, a steady decline is observed from 2020 onward, dropping to just 2 records by 2024, possibly due to data lag, reduced activity, or changes in policy. While the overall trend highlights a peak in 2019 after consistent growth, the most recent years indicate a downward trajectory. Notably, the x-axis is mislabeled as "Axis Title," which should be corrected for clarity, and further context about the nature of the records would enhance understanding.
Publication Year Trend (PL)
The graph below discloses an account of the count of patent applications/publications versus the year in which they were published.
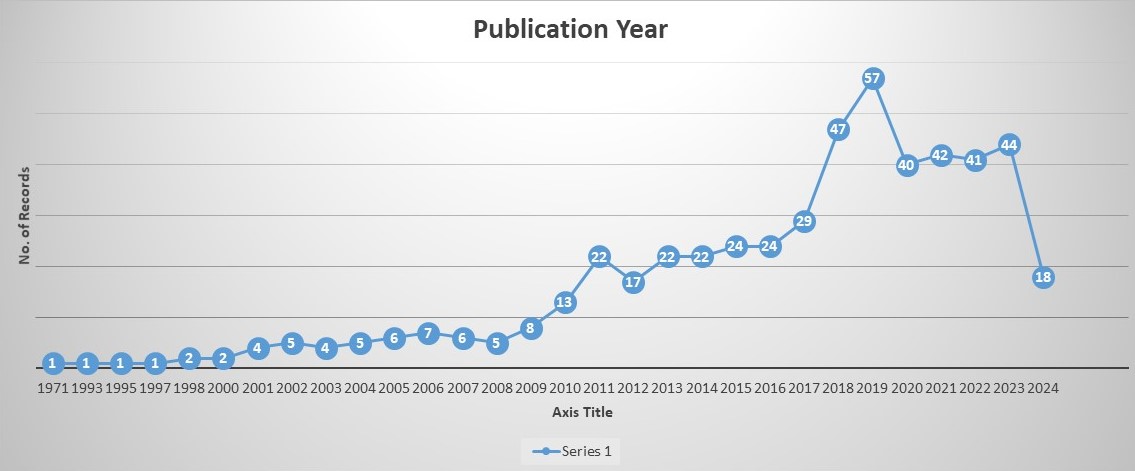
Interestingly, there was a drastic spike in the number of patent applications published between the years 2015 and 2023, with the highest count of 161 in the year 2023.
The chart titled "Publication Year" displays the number of records published annually from 1971 to 2024. From 1971 to 2008, the number of records remained low and relatively stable, fluctuating between 1 and 7 records per year. A steady increase began around 2009, with a noticeable jump to 13 records in 2010, followed by a rise to 22 in 2011. From 2012 to 2017, publication numbers grew moderately, hovering between 22 and 29 records annually. A sharp spike occurred in 2018 and 2019, peaking at 57 records in 2019, indicating a significant surge in publication activity. Afterward, a decline is observed, with records dropping to 40 in 2020 and fluctuating slightly through 2023, followed by a sharp decrease to just 18 records in 2024. This recent decline could be attributed to incomplete data for the most recent year or a true reduction in publications. Similar to the previous chart, the x-axis is incorrectly labeled as "Axis Title," which should be updated for clarity.
Top Assignee
The graph below discloses an account of the count of patent by top assignees.
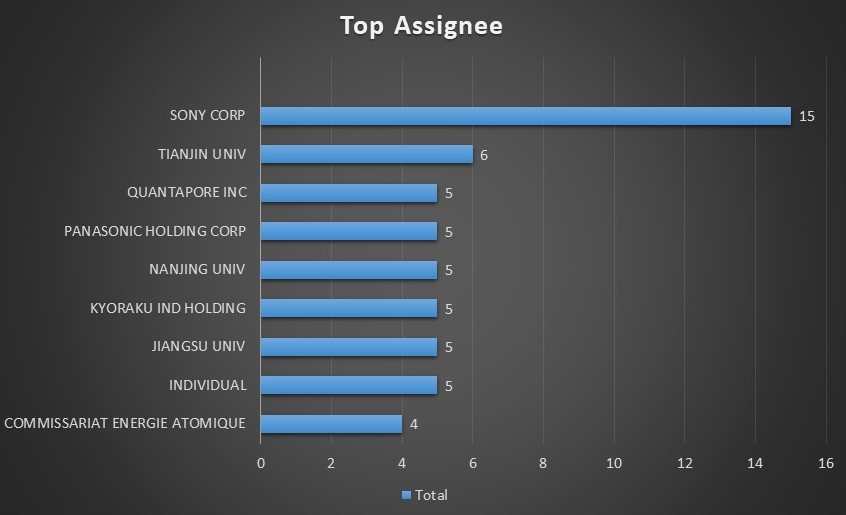
The bar chart titled "Top Assignee" displays the number of records assigned to the leading organizations or individuals. Sony Corp stands out significantly as the top assignee with 15 records, far surpassing all others. Tianjin University follows with 6 records, while a group of eight assignees - including Quantapore Inc, Panasonic Holding Corp, Nanjing University, Kyoraku Industrial Holding, Jiangsu University, Individual, and Commissariat Energie Atomique - each hold between 4 and 5 records. This distribution highlights Sony Corp's dominant role in filings or ownership, with universities and corporations forming a diverse mix of other frequent assignees.
Geographical Coverage
The below presentation shows the patent families by protection country. China holds top in the list followed by United States and Japan.
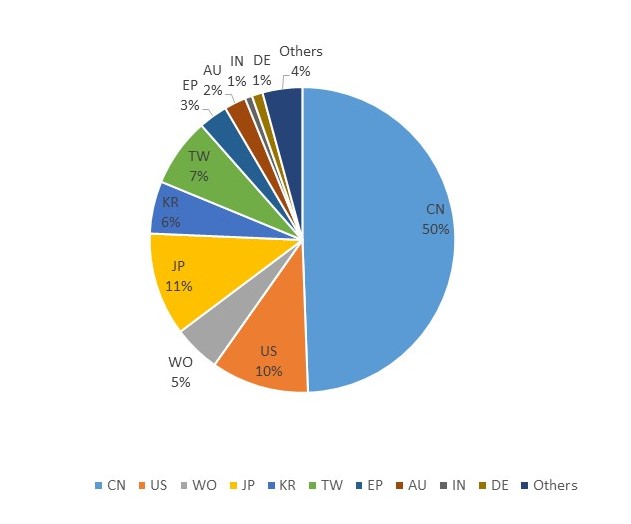
The pie chart titled "Top Publication Country" illustrates the distribution of records by publication country or region. China (CN) leads overwhelmingly, accounting for 50% of the total publications, followed by Japan (JP) at 11%, and the United States (US) at 10%. Other notable contributors include Taiwan (TW) with 7%, South Korea (KR) with 6%, and World Intellectual Property Organization (WO) filings at 5%. The European Patent Office (EP) makes up 3%, while Australia (AU), India (IN), and Germany (DE) each contribute 1%. The remaining 4% is categorized under Others. This distribution highlights China's dominant role in patent publications within the dataset, with a significant lead over all other countries or regions.
Related Resources
Nano Diamond Batteries – Overview and Key Players
Future Energy: Nano Diamond Battery Solutions
About Effectual
Effectual Services is an award-winning Intellectual Property (IP) management advisory & consulting firm offering IP intelligence to Fortune 500 companies, law firms, research institutes and universities, and venture capital firms/PE firms, globally.
Through research & intelligence we help our clients in taking critical business decisions backed with credible data sources, which in turn helps them achieve their organisational goals, foster innovation and achieve milestones within timelines while optimising costs.
Solutions Driving Innovation & Intelligence


Enabling Fortune 500's, R&D Giants, Law firms, Universities, Research institutes & SME's Around The Globe Gather Intelligence That
Protects and Nurtures Innovation Through a Team of 250+ Techno Legal Professionals.
